Beginner-Level
Power BI Videos
and for free?
In these 9 free beginner-level videos, you will learn:
What Business Intelligence is and the specific architecture of Power BI.
How to install Power BI Desktop.
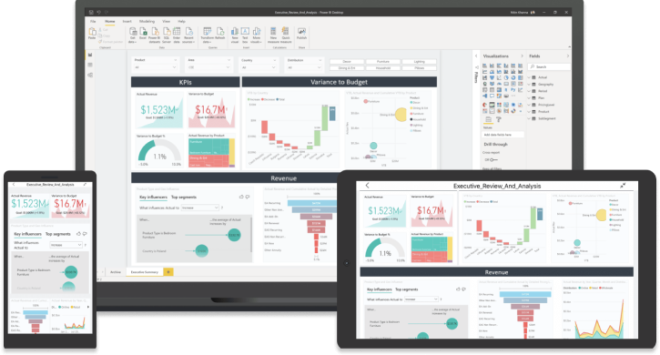
How to generate a step-by-step sales report, like the one shown in the following link.

I. What is Business Intelligence?
Before we dive into working with Power BI, let’s first examine the “BI” in Power BI, which stands for “Business Intelligence.”
In this class, we will explore the advantages of implementing Business Intelligence tools and the fundamental processes that include ETL (Extract, Transform, Load), data modeling, and data visualization.
II. What is Power BI? Benefits, Architecture, and Costs
In this class, we will explore how Microsoft Power BI allows you to execute all those BI processes (as discussed in Class I) within a single tool.
We will also examine the difference between Power BI Desktop and the Power BI web service, along with the associated costs for each. Understanding these distinctions is crucial to making informed decisions regarding your Power BI usage.
III. Download and Install Power BI Desktop
In this class, we’ll guide you through the process of downloading and installing Power BI Desktop, the essential software that enables you to create impactful data visualizations and reports.
A hands-on demonstration will make the installation process straightforward, ensuring you’re equipped to dive into the world of Power BI
IV. Configure Microsoft Power BI
Before you start creating your report, it’s important to make some adjustments to the general settings in Microsoft Power BI. This class will walk you through the process of configuring Power BI to suit your needs and preferences. These initial settings will help you streamline your reporting and data visualization efforts.
V. Introducción a Power Query (ETL)
We will begin creating a report in Power BI using data from three Excel sources, which you can download from this link:
In this class, you will learn what Power Query is and explore basic data transformations that you can apply.
VI. How to Create a Report in Power BI Desktop: Basic Visualizations
In this class, I will teach you how to create your first report in Power BI Desktop. We will generate a table, a bar chart, a line chart, and a map.
VII: Add Filters to Your Power BI Report
Report users are interested in interacting with the data to discover insights and make decisions.
To make this task easier for them, we will add filters (data slicers) to the report.
VIII: Improve the Appearance of Your Reports in Power BI
Do you want your Power BI reports to look professional?
In this class, we will show you how to add custom backgrounds to reports in Power BI Desktop. Working with backgrounds allows you to ensure that all reports you create for your organization are visually consistent and appealing.
At Analytic Mood, we design specific backgrounds and JSON themes for our clients to ensure that all reports are visually professional and consistent.
IX. Data Refresh in Power BI Desktop
We have completed the report in Power BI Desktop. Now, let’s learn how to refresh it when the data source changes (e.g., when new sales data becomes available in the organization).
Reporting Platform
Attain real-time transparency and enhanced insight into your business’s performance through tailor-made reports and compelling visualizations, empowering you to make well-informed decisions.


In-Company
Training
Empower your team through tailored, on-site training, strengthening their expertise in essential tools and techniques for management and data analysis.
Join the mood of
digital transformation
At analytic mood , we place our trust in Microsoft’s Business Intelligence tools due to their:
Experience and Reputation
A technological leader with decades of experience in business solutions.
Comprehensive Platform
A wide range of BI tools and services, such as Power BI and SQL Server Analysis Services.
Integration
Solutions seamlessly integrate with other Microsoft products like SharePoint, Excel, and Teams.
Scalability and Flexibility
Adapted to changing organizational needs, for both small projects and large-scale implementations.
Support and Active Community
Extensive technical support and a highly active user community.

Book your appointment! We can assist you!

