Automate Your Reports
Microsoft Power BI
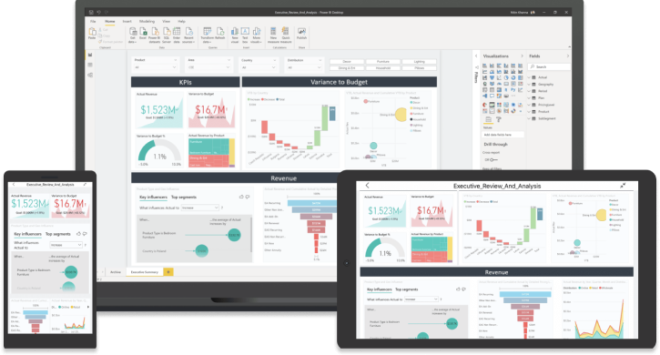
Attain real-time transparency and enhanced insight into your business’s performance through tailor-made reports and compelling visualizations, empowering you to make well-informed decisions.
Automate Your Reports
Microsoft Power BI
Attain real-time transparency and enhanced insight into your business’s performance through tailor-made reports and compelling visualizations, empowering you to make well-informed decisions.


Integration/Centralization
Unify all your data from different sources to streamline the decision-making process.

Access
Access the information you need from any device with internet access.

Custom Analysis
Transform your data into interactive reports that provide you with the business analytics you require.

Efficiency
Spend your time analyzing information and forget about manual report updates.

Collaboration
Easily share reports while controlling each collaborator’s access through role management.
Why Power BI as a
reporting solution?
Microsoft PowerBI is the market-leading tool for data visualization, included in the Office 365 package, and it allows connectivity to over 200 external data sources.
It seamlessly integrates with all Office suite applications and enables the development of a complete BI project.
It includes a free Desktop application for designing data models and visualizations, along with an affordable online service for sharing reports with other users.

Self Service & End User BI
Power BI excels in Self-Service & End User BI due to its ease of use and its ability to empower non-technical users to intuitively create data analysis and visualizations, without the need for programming skills or complex queries.
This fosters user autonomy and accelerates the delivery of insights, making it a powerful tool for driving data analysis throughout the organization.

Striking Visualizations
With Power BI, visualizations become a powerful tool for storytelling, uncovering patterns and trends, and presenting data in a graphically striking manner.

Gartner Magic Quadrant
Power BI stands out as the top data analysis and visualization tool, thanks to its position as a leader in Gartner’s Magic Quadrant.
With its consistent recognition in the rankings, Power BI demonstrates its excellence in the business analytics industry.
With its extensive feature set, user-friendliness, and long-term investment, it provides organizations with a leading and reliable solution to harness information to create a competitive edge in the market.

Data Sources
Power BI can connect to a wide range of data sources, including relational databases, flat files, cloud services, and software applications.
This makes data consolidation easy and enables the creation of integrated visualizations and analyses that help gain a comprehensive and detailed view of business information.

Architecture
Power BI provides a streamlined workflow by allowing users to perform the entire process of Extraction, Transformation, and Loading (ETL), data modeling, and visualizations on a single platform.
This integration of functions within a single software simplifies and speeds up the data analysis process, eliminating the need to use different applications and providing a smooth and efficient user experience.

Dashboards that integrate all your company's data
and update automatically.
It is possible.

HHRR
Monitor employee retention rate, hiring costs, and absenteeism rates to identify areas for process improvement.

Production
Determine production cycle times, defect and rework rates, and downtime to identify bottlenecks, quality issues, and reduce process times.

Finance
Automate your accounting for continuous monitoring of your accounts and results.

Comercial
Review your top salespeople, customers, and products daily. Understand profitability results and compare them to previous years.

Marketing
Centralize the results of all your campaigns in one place and invest in the ones that generate the best results.

Finance
Automate your accounting for continuous monitoring of your accounts and results.

Comercial
Review your top salespeople, customers, and products daily. Understand profitability results and compare them to previous years.

Marketing
Centralize the results of all your campaigns in one place and invest in the ones that generate the best results.
Join the mood of
digital transformation
At analytic mood , we place our trust in Microsoft’s Business Intelligence tools due to their:
Experience and Reputation
A technological leader with decades of experience in business solutions.
Comprehensive Platform
A wide range of BI tools and services, such as Power BI and SQL Server Analysis Services.
Integration
Solutions seamlessly integrate with other Microsoft products like SharePoint, Excel, and Teams.
Scalability and Flexibility
Adapted to changing organizational needs, for both small projects and large-scale implementations.
Support and Active Community
Extensive technical support and a highly active user community.

Book your appointment! We can assist you.

